Publication 946 - Additional Material
This is archived information that pertains only to the 2006 Tax Year. If you
are looking for information for the current tax year, go to the Tax Prep Help Area.
Appendix A--Modified Accelerated Cost Recovery System Percentage Table Guide--General Depreciation System--Alternative Depreciation
System. Summary: These charts are used to locate which table you are to use to find the percentage rate of depreciation on property.
Chart 1 is used
for all property other than residential rental and nonresidential real. Chart 2 is used for residential rental and nonresidential
real property. Chart
3 is for income inclusion amount rates for Modified Accelerated Cost Recovery System Leased Listed Property.
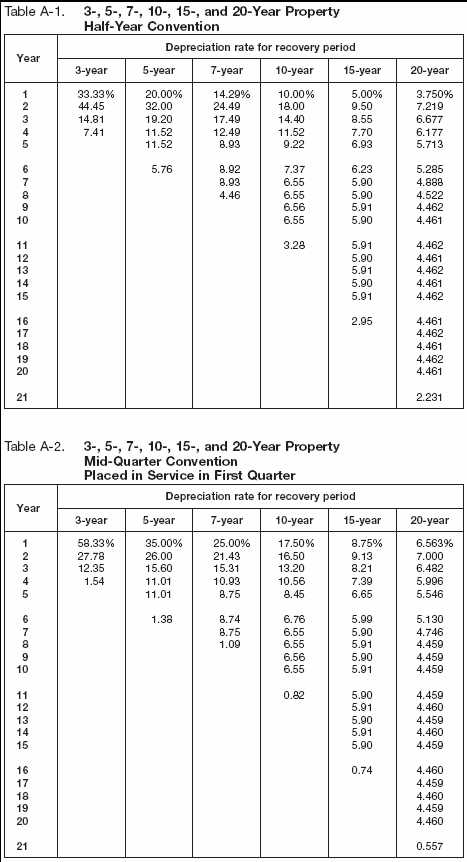
Tables A-1 and A-2. Summary: These tables are used to determine the percentage rate used in calculating the depreciation of property. Table A-1
is for 3-, 5-, 7-,
10-, 15-, and 20-Year Property using the Half-Year Convention and lists the percentages for years 1 through 21 under each
category of recovery period.
Table A-2 is for 3-, 5-, 7-, 10-, 15-, and 20-Year Property using Mid-Quarter Convention and Placed in Service in First Quarter
and lists the
percentages for years 1 through 21 under each category of recovery period.
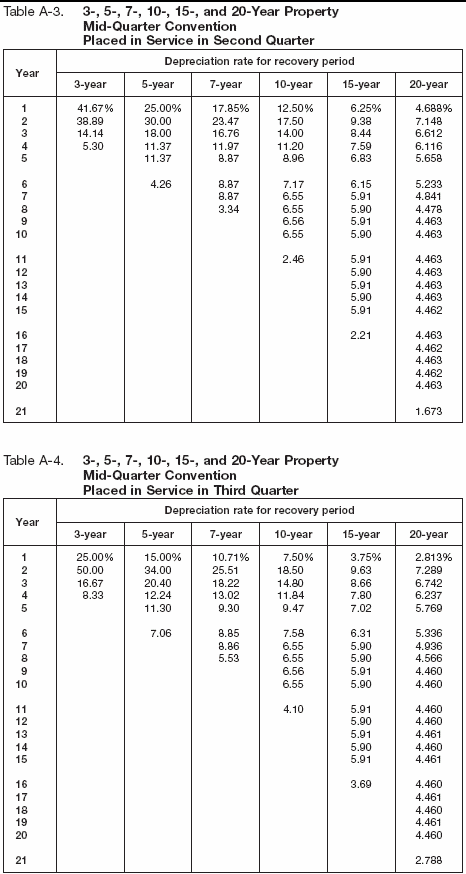
Tables A-3 and A-4. Summary: These tables are used to determine the percentage rate used in calculating the depreciation of property. Table A-3
is for 3-, 5-, 7-,
10-, 15-, and 20-Year Property using the Mid-Quarter Convention and Placed in Service in Second Quarter and lists the percentages
for years 1 through
21 under each category of recovery period. Table A-4 is for 3-, 5-, 7-, 10-, 15-, and 20-Year Property using Mid-Quarter Convention
and Placed in
Service in Third Quarter and lists the percentages for years 1 through 21 under each category of recovery period.
Tables A-5 and A-6. Summary: These tables are used to determine the percentage rate used in calculating the depreciation of property. Table A-5
is for 3-, 5-, 7-,
10-, 15-, and 20-Year Property using the Mid-Quarter Convention and Placed in Service in Fourth Quarter and lists the percentages
for years 1 through
21 under each category of recovery period. Table A-6 is for Residential Rental Property using Mid-Month Convention and Straight
Line
depreciation--27.5 Years and lists the percentages for years 1 through 29 by month placed in service.
Tables A-7 and A-7a. Summary: These tables are used to determine the percentage rate used in calculating the depreciation of property. Table A-7
is for
Nonresidential Real Property, using the Mid-Month Convention and Straight Line depreciation--31.5 years and lists the percentages
for years 1 through
33 by month placed in service. Table A-7a is for Nonresidential Real Property, using the Mid-Month Convention and Straight
Line depreciation--39 years
and lists the percentages for years 1, 2-39, and 40 by month placed in service.
Table A-8. Summary: This table is used to determine the percentage rate used in calculating the depreciation of property. It lists the
percentages for
property based on the Straight Line method of depreciation using the Half-Year Convention. This section of the table is for
years 1 through 10 with
recovery periods from 2.5 years to 9.5 years and years 1 through 18 with recovery periods from 10 years to 17 years.
Table A-8--(Continued). Summary: This table is used to determine the percentage rate used in calculating the depreciation of property. It lists the
percentages for
property based on the Straight Line method of depreciation using the Half-Year Convention. This section of the table is for
years 1 through 51 with
recovery period increments from 18 to 50 years.
Table A-9. Summary: This table is used to determine the percentage rate used in calculating the depreciation of property. It lists the
percentages for
property based on the Straight Line method of depreciation using the Mid-Quarter Convention and Placed in Service in First
Quarter. This section of
the table is for years 1 through 10 with recovery periods from 2.5 years to 9.5 years and years 1 through 18 with recovery
periods from 10 years to 17
years.
Table A-9--(Continued). Summary: This table is used to determine the percentage rate used in calculating the depreciation of property. It lists the
percentages for
property based on the Straight Line method of depreciation using the Mid-Quarter Convention and Placed in Service in First
Quarter. This section of
the table is for years 1 through 51 with recovery period increments from 18 to 50 years.
Table A-10. Summary: This table is used to determine the percentage rate used in calculating the depreciation of property. It lists the
percentages for
property based on the Straight Line method of depreciation using the Mid-Quarter Convention and Placed in Service in Second
Quarter. This section of
the table is for years 1 through 10 with recovery periods from 2.5 to 9.5 years and for years 1 through 18 with recovery periods
from 10 years to 17
years.
Table A-10--(Continued). Summary: This table is used to determine the percentage rate used in calculating the depreciation of property. It lists the
percentages for
property based on the Straight Line method of depreciation using the Mid-Quarter Convention and Placed in Service in Second
Quarter. This section of
the table is for years 1 through 51 with recovery period increments from 18 to 50 years.
Table A-11. Summary: This table is used to determine the percentage rate used in calculating the depreciation of property. It lists the
percentages for
property based on the Straight Line method of depreciation using the Mid-Quarter Convention and Placed in Service in Third
Quarter. This section of
the table is for years 1 through 11 with recovery periods from 2.5 to 9.5 years and for years 1 through 18 with recovery periods
from 10 years to 17
years.
Table A-11--(Continued). Summary: This table is used to determine the percentage rate used in calculating the depreciation of property. It lists the
percentages for
property based on the Straight Line method of depreciation using the Mid-Quarter Convention and Placed in Service in Third
Quarter. This section of
the table is for years 1 through 51 with recovery period increments from 18 to 50 years.
Table A-12. Summary: This table is used to determine the percentage rate used in calculating the depreciation of property. It lists the
percentages for
property based on the Straight Line method of depreciation using the Mid-Quarter Convention and Placed in Service in Fourth
Quarter. This section of
the table is for years 1 through 11 with recovery periods from 2.5 to 9.5 years and for years 1 through 18 with recovery periods
from 10 years to 17
years.
Table A-12--(Continued). Summary: This table is used to determine the percentage rate used in calculating the depreciation of property. It lists the
percentages for
property based on the Straight Line method of depreciation using the Mid-Quarter Convention and Placed in Service in Fourth
Quarter. This section of
the table is for years 1 through 51 with recovery period increments from 18 years to 50 years.
Tables A-13 and A-14. Summary: These tables are used to determine the percentage rate used in calculating the depreciation of property. Table A-13
lists the
percentages for property based on the Straight Line method of depreciation using the Mid-Month Convention and lists for years
1, 2-40, and 41 by month
placed in service. Table A-14 lists the percentages for property based on 150% Declining Balance method using Half-Year Convention
and lists for years
1 through 10 with recovery periods of 2.5 to 9.5 years and for year 1 through 18 with recovery periods of 10 to 17 years.
Table A-14--(Continued). Summary: This table is used to determine the percentage rate used in calculating the depreciation of property. It lists the
percentages for
property based on 150% Declining Balance method using Half-Year Convention and lists for years 1 through 51 with recovery
period increments of 18
through 50 years.
Table A-15. Summary: This table is used to determine the percentage rate used in calculating the depreciation of property. It lists the
percentages for
property based on the 150% Declining Balance method of depreciation using the Mid-Quarter Convention, Placed in Service in
First Quarter. This section
of the table is for years 1 through 10 with recovery periods from 2.5 to 9.5 years and for years 1 through 18 with recovery
periods from 10 to 17
years.
Table A-15--(Continued). Summary: This table is used to determine the percentage rate used in calculating the depreciation of property. It lists the
percentages for
property based on the 150% Declining Balance method of depreciation using the Mid-Quarter Convention, Placed in Service in
First Quarter. This section
of the table is for years 1 through 51 with recovery period increments from 18 to 50 years.
Table A-16. Summary: This table is used to determine the percentage rate used in calculating the depreciation of property. It lists the
percentages for
property based on the 150% Declining Balance method of depreciation using the Mid-Quarter Convention, Placed in Service in
Second Quarter. This
section of the table is for years 1 through 10 with recovery periods from 2.5 to 9.5 years and for years 1 through 18 with
recovery periods from 10 to
17 years.
Table A-16--(Continued). Summary: This table is used to determine the percentage rate used in calculating the depreciation of property. It lists the
percentages for
property based on the 150% Declining Balance method of depreciation using the Mid-Quarter Convention, Placed in Service in
Second Quarter. This
section of the table is for years 1 through 51 with recovery period increments from 18 to 50 years.
Table A-17. Summary: This table is used to determine the percentage rate used in calculating the depreciation of property. It lists the
percentages for
property based on the 150% Declining Balance method of depreciation using the Mid-Quarter Convention, Placed in Service in
Third Quarter. This section
of the table is for years 1 through 11 with recovery periods from 2.5 to 9.5 years and for years 1 through 18 with recovery
periods from 10 to 17
years.
Table A-17--(Continued). Summary: This table is used to determine the percentage rate used in calculating the depreciation of property. It lists the
percentages for
property based on the 150% Declining Balance method of depreciation using the Mid-Quarter Convention, Placed in Service in
Third Quarter. This section
of the table is for years 1 through 51 with recovery period increments from 18 to 50 years.
Table A-18. Summary: This table is used to determine the percentage rate used in calculating the depreciation of property. It lists the
percentages for
property based on the 150% Declining Balance method of depreciation using the Mid-Quarter Convention, Placed in Service in
Fourth Quarter. This
section of the table is for years 1 through 11 with recovery periods from 2.5 to 9.5 years and for years 1 through 18 with
recovery periods from 10 to
17 years.
Table A-18--(Continued). Summary: This table is used to determine the percentage rate used in calculating the depreciation of property. It lists the
percentages for
property based on the 150% Declining Balance method of depreciation using the Mid-Quarter Convention, Placed in Service in
Fourth Quarter. This
section of the table is for years 1 through 51 with recovery period increments from 18 to 50 years.
RATES TO FIGURE INCLUSION AMOUNTS FOR LEASED LISTED PROPERTY Tables A-19 and A-20. Summary: These tables are for determining the percentages used for depreciation on Leased Listed Property. They each list
the recovery periods
of property under Alternative Depreciation System for: less than 7 years, 7 to 10 years, and more than 10 years and determine
the percentage for each
by the first tax year during lease in which business use is 50% or less.
Appendix B — Table of Class Lives and Recovery Periods
The Table of Class Lives and Recovery Periods has two sections. The first section, Specific Depreciable Assets Used In All Business
Activities, Except As Noted, generally lists assets used in all business activities. It is shown as Table B-1. The second section,
Depreciable Assets Used In The Following Activities, describes assets used only in certain activities. It is shown as Table B-2.
You will need to look at both Table B-1 and B-2 to find the correct recovery period. Generally, if the property is listed
in Table B-1 you use the
recovery period shown in that table. However, if the property is specifically listed in Table B-2 under the type of activity
in which it is used, you
use the recovery period listed under the activity in that table. Use the tables in the order shown below to determine the
recovery period of your
depreciable property.
Table B-1.
Check Table B-1 for a description of the property. If it is described in Table B-1, also check Table B-2 to find the
activity in which the property
is being used. If the activity is described in Table B-2, read the text (if any) under the title to determine if the property
is specifically included
in that asset class. If it is, use the recovery period shown in the appropriate column of Table B-2 following the description
of the activity. If the
activity is not described in Table B-2 or if the activity is described but the property either is not specifically included
in or is specifically
excluded from that asset class, then use the recovery period shown in the appropriate column following the description of
the property in Table B-1.
Tax-exempt use property subject to a lease.
The recovery period for ADS cannot be less than 125 percent of the lease term for any property leased under a leasing
arrangement to a tax-exempt
organization, governmental unit, or foreign person or entity (other than a partnership).
Table B-2.
If the property is not listed in Table B-1, check Table B-2 to find the activity in which the property is being used
and use the recovery period
shown in the appropriate column following the description.
Property not in either table.
If the activity or the property is not included in either table, check the end of Table B-2 to find
Certain Property for Which Recovery
Periods Assigned. This property generally has a recovery period of 7 years for GDS or 12 years for ADS. See
Which Property Class Applies
Under GDS and
Which Recovery Period Applies in chapter 4 for the class lives or the recovery periods for GDS and ADS for the
following.
-
Residential rental property and nonresidential real property (also see Appendix A, Chart 2).
-
Qualified rent-to-own property.
-
A motorsport entertainment complex.
-
Any retail motor fuels outlet.
-
Any qualified leasehold improvement property placed in service before January 1, 2008.
-
Any qualified restaurant property placed in service before January 1, 2008.
-
Initial clearing and grading land improvements for gas utility property and electric utility transmission and distribution
plants.
-
Any water utility property.
-
Certain electric transmission property used in the transmission at 69 or more kilovolts of electricity for sale and placed
in service after
April 11, 2005.
-
Natural gas gathering and distribution lines placed in service after April 11, 2005.
Example 1.
Richard Green is a paper manufacturer. During the year, he made substantial improvements to the land on which his paper plant
is located. He checks
Table B-1 and finds land improvements under asset class 00.3. He then checks Table B-2 and finds his activity, paper manufacturing,
under asset class
26.1, Manufacture of Pulp and Paper. He uses the recovery period under this asset class because it specifically includes land improvements.
The land improvements have a 13-year class life and a 7-year recovery period for GDS. If he elects to use ADS, the recovery
period is 13 years. If
Richard only looked at Table B-1, he would select asset class 00.3, Land Improvements, and incorrectly use a recovery period of 15 years
for GDS or 20 years for ADS.
Example 2.
Sam Plower produces rubber products. During the year, he made substantial improvements to the land on which his rubber plant
is located. He checks
Table B-1 and finds land improvements under asset class 00.3. He then checks Table B-2 and finds his activity, producing rubber
products, under asset
class 30.1, Manufacture of Rubber Products. Reading the headings and descriptions under asset class 30.1, Sam finds that it does not
include land improvements. Therefore, Sam uses the recovery period under asset class 00.3. The land improvements have a 20-year
class life and a
15-year recovery period for GDS. If he elects to use ADS, the recovery period is 20 years.
Example 3.
Pam Martin owns a retail clothing store. During the year, she purchased a desk and a cash register for use in her business.
She checks Table B-1
and finds office furniture under asset class 00.11. Cash registers are not listed in any of the asset classes in Table B-1.
She then checks Table B-2
and finds her activity, retail store, under asset class 57.0, Distributive Trades and Services, which includes assets used in
wholesale and retail trade. This asset class does not specifically list office furniture or a cash register. She looks back at Table B-1 and
uses asset class 00.11 for the desk. The desk has a 10-year class life and a 7-year recovery period for GDS. If she elects
to use ADS, the recovery
period is 10 years. For the cash register, she uses asset class 57.0 because cash registers are not listed in Table B-1 but
it is an asset
used in her retail business. The cash register has a 9-year class life and a 5-year recovery period for GDS. If she elects
to use the ADS method, the
recovery period is 9 years.
Table B-1. Table of Class Lives and Recovery Periods. Summary: This table lists the recovery periods (in years) for specific depreciable assets used in all business activities
except as noted. The
table lists the asset class, description of asset, the recovery periods for: Class Life (in years), General Depreciation System
(Modified Accelerated
Cost Recovery System) and Alternative Depreciation System. This section lists the asset classes of 00.11--Office Furniture,
Fixtures, and Equipment to
00.4--Industrial Steam and Electric Generation and/or Distribution Systems.
Table B-2. Table of Class Lives and Recovery Periods. Summary: This table lists the recovery periods (in years) for depreciable assets used listed business activities. The table
lists the asset
class, description of asset, the recovery periods for: Class Life (in years), General Depreciation System (Modified Accelerated
Cost Recovery System)
and Alternative Depreciation System. This section lists the asset classes of 01.1--Agriculture to 20.5--Manufacture of Food
and Beverages--Special
Handling Devices.
Table B-2. Table of Class Lives and Recovery Periods. Summary: This table lists the recovery periods (in years) for depreciable assets used listed business activities. The table
lists the asset
class, description of asset, the recovery periods for: Class Life (in years), General Depreciation System (Modified Accelerated
Cost Recovery System)
and Alternative Depreciation System. This section lists the asset classes of 21.0--Manufacture of Tobacco and Tobacco Products
to 26.1--Manufacture of
Pulp and Paper.
Table B-2. Table of Class Lives and Recovery Periods. Summary: This table lists the recovery periods (in years) for depreciable assets used listed business activities. The table
lists the asset
class, description of asset, the recovery periods for: Class Life (in years), General Depreciation System (Modified Accelerated
Cost Recovery System)
and Alternative Depreciation System. This section lists the asset classes of 26.2--Manufacture of Converted Paper, Paperboard,
and Pulp Products to
32.3--Manufacture of Other Stone and Clay Products.
Table B-2. Table of Class Lives and Recovery Periods. Summary: This table lists the recovery periods (in years) for depreciable assets used listed business activities. The table
lists the asset
class, description of asset, the recovery periods for: Class Life (in years), General Depreciation System (Modified Accelerated
Cost Recovery System)
and Alternative Depreciation System. This section lists the asset classes of 33.2--Manufacture of Primary Nonferrous Metals
to 36.1--Any Semiconductor
Manufacturing Equipment.
Table B-2. Table of Class Lives and Recovery Periods. Summary: This table lists the recovery periods (in years) for depreciable assets used listed business activities. The table
lists the asset
class, description of asset, the recovery periods for: Class Life (in years), General Depreciation System (Modified Accelerated
Cost Recovery System)
and Alternative Depreciation System. This section lists the asset classes of 37.11--Manufacture of Motor Vehicles to 39.0--Manufacture
of Athletic,
Jewelry, and Other Goods and Railroad Transportation.
Table B-2. Table of Class Lives and Recovery Periods. Summary: This table lists the recovery periods (in years) for depreciable assets used listed business activities. The table
lists the asset
class, description of asset, the recovery periods for: Class Life (in years), General Depreciation System (Modified Accelerated
Cost Recovery System)
and Alternative Depreciation System. This section lists the asset classes of 40.1--Railroad Machinery and Equipment, Roadway
accounts and Equipment
accounts to 46.0--Pipeline Transportation.
Table B-2. Table of Class Lives and Recovery Periods. Summary: This table lists the recovery periods (in years) for depreciable assets used listed business activities. The table
lists the asset
class, description of asset, the recovery periods for: Class Life (in years), General Depreciation System (Modified Accelerated
Cost Recovery System)
and Alternative Depreciation System. This section lists the asset classes of 48.11--Telephone Communications and Telephone
Central Office Buildings to
48.39--Telegraph, Ocean Cable, and Satellite Communications--Support and Service Equipment and Cable Television.
Table B-2. Table of Class Lives and Recovery Periods. Summary: This table lists the recovery periods (in years) for depreciable assets used listed business activities. The table
lists the asset
class, description of asset, the recovery periods for: Class Life (in years), General Depreciation System (Modified Accelerated
Cost Recovery System)
and Alternative Depreciation System. This section lists the asset classes of 48.41--Cable Television--Headend to 49.25--Liquefied
Natural Gas
Plant.
Table B-2. Table of Class Lives and Recovery Periods. Summary: This table lists the recovery periods (in years) for depreciable assets used listed business activities. The table
lists the asset
class, description of asset, the recovery periods for: Class Life (in years), General Depreciation System (Modified Accelerated
Cost Recovery System)
and Alternative Depreciation System. This section lists the asset classes of 49.3--Water Utilities to (no asset class) Certain
Property for Which
Recovery Periods Assigned .
Tax Publications for Business Taxpayers See How To Get Tax Help for a variety of ways to get publications, including by computer, phone, and mail.
|
General Guides
|
|
1
|
Your Rights as a Taxpayer
|
|
17
|
Your Federal Income Tax (For Individuals)
|
|
334
|
Tax Guide for Small Business (For Individuals Who Use Schedule C or C-EZ)
|
|
509
|
Tax Calendars for 2007
|
|
553
|
Highlights of 2006 Tax Changes
|
|
910
|
IRS Guide to Free Tax Services
|
|
Employer's Guides
|
|
15
|
(Circular E), Employer's Tax Guide
|
|
15-A
|
Employer's Supplemental Tax Guide
|
|
15-B
|
Employer's Tax Guide to Fringe Benefits
|
|
51
|
(Circular A), Agricultural Employer's Tax Guide
|
|
80
|
(Circular SS), Federal Tax Guide For Employers in the U.S. Virgin Islands, Guam, American Samoa, and the Commonwealth of the
Northern Mariana Islands
|
|
926
|
Household Employer's Tax Guide
|
|
Specialized Publications
|
|
225
|
Farmer's Tax Guide
|
|
463
|
Travel, Entertainment, Gift, and Car Expenses
|
|
505
|
Tax Withholding and Estimated Tax
|
|
510
|
Excise Taxes for 2007
|
|
515
|
Withholding of Tax on Nonresident Aliens and Foreign Entities
|
|
517
|
Social Security and Other Information for Members of the Clergy and Religious Workers
|
|
527
|
Residential Rental Property (Including Rental of Vacation Homes)
|
|
534
|
Depreciating Property Placed in Service Before 1987
|
|
535
|
Business Expenses
|
|
536
|
Net Operating Losses (NOLs) for Individuals, Estates, and Trusts
|
|
537
|
Installment Sales
|
|
538
|
Accounting Periods and Methods
|
|
541
|
Partnerships
|
|
542
|
Corporations
|
|
544
|
Sales and Other Dispositions of Assets
|
|
551
|
Basis of Assets
|
|
556
|
Examination of Returns, Appeal Rights, and Claims for Refund
|
|
560
|
Retirement Plans for Small Business (SEP, SIMPLE, and Qualified Plans)
|
|
561
|
Determining the Value of Donated Property
|
|
583
|
Starting a Business and Keeping Records
|
|
587
|
Business Use of Your Home (Including Use by Daycare Providers)
|
|
594
|
What You Should Know About The IRS Collection Process
|
|
595
|
Capital Construction Fund for Commercial Fishermen
|
|
597
|
Information on the United States-Canada Income Tax Treaty
|
|
598
|
Tax on Unrelated Business Income of Exempt Organizations
|
|
686
|
Certification for Reduced Tax Rates in Tax Treaty Countries
|
|
901
|
U.S. Tax Treaties
|
|
908
|
Bankruptcy Tax Guide
|
|
925
|
Passive Activity and At-Risk Rules
|
|
946
|
How To Depreciate Property
|
|
947
|
Practice Before the IRS and Power of Attorney
|
|
954
|
Tax Incentives for Distressed Communities
|
|
1544
|
Reporting Cash Payments of Over $10,000 (Received in a Trade or Business)
|
|
1546
|
The Taxpayer Advocate Service of the IRS
|
|
Spanish Language Publications
|
|
1SP
|
Derechos del Contribuyente
|
|
179
|
(Circular PR) Guía Contributiva Federal Para Patronos Puertorriqueños
|
|
579SP
|
Cómo Preparar la Declaración de Impuesto Federal
|
|
594SP
|
Qué es lo Debemos Saber sobre El Proceso de Cobro del IRS
|
|
850
|
English-Spanish Glossary of Words and Phrases Used in Publications Issued by the Internal Revenue Service
|
|
1544SP
|
Informe de Pagos en Efectivo en Exceso de $10,000 (Recibidos en una Ocupación o
Negocio)
|
Commonly Used Tax Forms See How To Get Tax Help for a variety of ways to get forms, including by computer, phone, and mail.
|
Form Number and Form Title
|
|
W-2
|
Wage and Tax Statement
|
|
W-4
|
Employee's Withholding Allowance Certificate
|
|
940
|
Employer's Annual Federal Unemployment (FUTA) Tax Return
|
|
941
|
Employer's QUARTERLY Federal Tax Return
|
|
944
|
Employer's ANNUAL Federal Tax Return
|
|
1040
|
U.S. Individual Income Tax Return
|
|
Sch. A & B
|
Itemized Deductions & Interest and Ordinary Dividends
|
|
Sch. C
|
Profit or Loss From Business
|
|
Sch. C-EZ
|
Net Profit From Business
|
|
Sch. D
|
Capital Gains and Losses
|
|
Sch. D-1
|
Continuation Sheet for Schedule D
|
|
Sch. E
|
Supplemental Income and Loss
|
|
Sch. F
|
Profit or Loss From Farming
|
|
Sch. H
|
Household Employment Taxes
|
|
Sch. J
|
Income Averaging for Farmers and Fishermen
|
|
Sch. R
|
Credit for the Elderly or the Disabled
|
|
Sch. SE
|
Self-Employment Tax
|
|
1040-ES
|
Estimated Tax for Individuals
|
|
1040X
|
Amended U.S. Individual Income Tax Return
|
|
1065
|
U.S. Return of Partnership Income
|
|
Sch. D
|
Capital Gains and Losses
|
|
Sch. K-1
|
Partner's Share of Income, Deductions, Credits, etc.
|
|
1120
|
U.S. Corporation Income Tax Return
|
|
1120-A
|
U.S. Corporation Short-Form Income Tax Return
|
|
1120S
|
U.S. Income Tax Return for an S Corporation
|
|
Sch. D
|
Capital Gains and Losses and Built-In Gains
|
|
Sch. K-1
|
Shareholder's Share of Income, Deductions, Credits, etc.
|
|
2106
|
Employee Business Expenses
|
|
2106-EZ
|
Unreimbursed Employee Business Expenses
|
|
2210
|
Underpayment of Estimated Tax by Individuals, Estates, and Trusts
|
|
2441
|
Child and Dependent Care Expenses
|
|
2848
|
Power of Attorney and Declaration of Representative
|
|
3800
|
General Business Credit
|
|
3903
|
Moving Expenses
|
|
4562
|
Depreciation and Amortization
|
|
4797
|
Sales of Business Property
|
|
4868
|
Application for Automatic Extension of Time To File U.S. Individual Income Tax Return
|
|
5329
|
Additional Taxes on Qualified Plans (Including IRAs) and Other Tax-Favored Accounts
|
|
6252
|
Installment Sale Income
|
|
7004
|
Application for Automatic 6-Month Extension of Time To File Certain Business Income Tax, Information, and Other
Returns
|
|
8283
|
Noncash Charitable Contributions
|
|
8300
|
Report of Cash Payments Over $10,000 Received in a Trade or Business
|
|
8582
|
Passive Activity Loss Limitations
|
|
8606
|
Nondeductible IRAs
|
|
8822
|
Change of Address
|
|
8829
|
Expenses for Business Use of Your Home
|